I’m very interested in contrails, but when you look for information about them on the internet, half the sites that turn up are about a conspiracy theory which claims that any trail that last more than a few minutes is actually a “chemtrail”, comprised of dangerous chemicals, particularly barium.
There are even web sites, where people who are convinced this theory is correct are taking the highly laudable step of attempting to verify their hypotheses with scientific experiments.
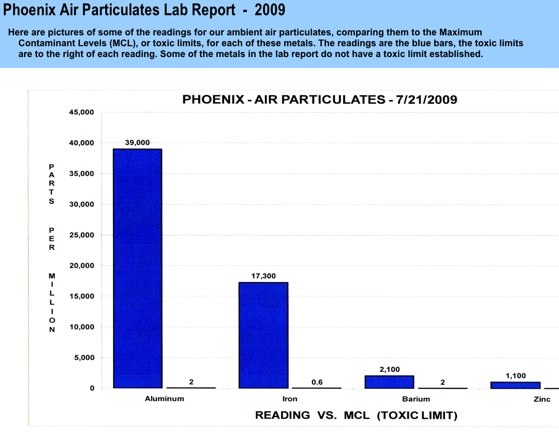
Unfortunately, they get the science terribly and inexcusably wrong. Take, for example, this graph found on the Arizona Skywatch site:

In particular, look at the first column. It shows a concentration of barium in the air of 556,000 ppb (parts per billion), vs. a “Toxic Limit” of 2,000 ppb. Clearly something is terribly wrong, we’ve got nearly 600 times the toxic limit of Barium in the air. Why are people not dropping dead all over Phoenix?
The first mistake is the value used for “Toxic Limit”. 2000 ppb is actually the EPS’s limit for barium in water, not in air. The limit for barium in air is 5 mg/m3 according to the OSHA. What’s that in ppb? Well, one m3 (cubic meter) of air weighs 1.2 kg, so that’s about 4000 ppb. Not significantly different from 2000 ppb, but as we’ll see. The fact that we are measuring the concentration in air is very important.
Still, 300 times over the toxic limit? And these limits were actually set for people who worked in barium plants. How much barium would you expect to find in the air in a normal city? The CDC’s has done some research:
Background levels of barium in the environment are very low. The air that most people breathe contains about 0.0015 parts of barium per billion parts of air (ppb). The air around factories that release barium compounds into the air has about 0.33 ppb or less of barium. Most surface water and public water supplies contain on average 30 parts of barium per billion parts of water (ppb) or less, but can average as high as 300 ppb in some regions of the United States. In some areas that have underground water wells, drinking water may contain more barium than the 2000 ppb limit set by EPA. The highest amount measured from these water wells has been 10,000 ppb. The amount of barium found in soil ranges from about 15,000 to 3,500,000 ppb.
The above paragraph has been modified to convert all the units to ppb. The original mixed ppm and ppb, which can be confusing.
But there’s a scary thing: the air that most people breath is 0.0015 ppb barium. That means the level found in Phoenix (556,000 ppb) is 370,000,000 times the normal amount!
So what’s going on here? What’s up with these crazy figures?
It turns out the answer is quite simple: they did not actually measure the concentration of barium in the air, they measured the concentration of barium in the airborne particulates.
That’s right, they measured how much barium there is in outdoor dust and smog. In the countryside the airborne dust has a lot of soil in it (especially with the noted “strong Arizona winds and dust storms), and in the city it also has industrial emissions. The amount of barium found is right in the normal range for soil (15,000 – 3,500,000 ppb), and being from a city, you’d also expect some barium emissions in there to bump up the figure. In short, these results are well within the normal (and safe) ranges.
But how did this mistake come about?
To measure the concentration of a particulate substance in air, you can do just what SkyWatch did – you run a vacuum cleaner for a while with a clean air filter, and then you collect the particulate matter from the filter and analyse it’s composition. You then do the one thing missing here: you multiply the result by the weight of the particulate sample divided by the weight of the air the sample was extracted from.
Air weighs 1.2Kg per cubic meter a cubic meter is 1000 liters. A vacuum cleaner can pull through
80 liters per minute, meaning we would get 1kg or air in about ten minutes, or 6 kg in an hour. But how exactly was the sample collected? See here:
http://d1027732.mydomainwebhost.com/charts/our%20charts/index.html
We also took air samples in Phoenix, on non-windy days, using a HEPA filter, then vacuuming the particulates from that filter into another pristine HEPA filter, which we then emptied into a sterile container.
Unfortunately they neglect to say how long they vacuumed for, but it must have been long enough to get some measurable amount of particulates on the filter. So let’s say an hour, and they got one gram (a pinch of salt worth).
So that would be 6Kg of air, meaning, with a 1g sample, we need to adjust our figures by a factor or 1/6000, which bring the claimed 556,000 ppb to 92 ppb, much closer to our normal range, and much lower than the OSHA limit of 4000 ppb.
So, bravo to Arizona Skywatch for trying to put some science behind their claims. But unfortunately they were not measuring what they though they were, and unless they can better describe their collection method, including how long they ran the vacuum for, and how much the submitted sample weighed, then their results are essentially meaningless, and show nothing more than normal air particulates.
So, how long will it take them to correct their site?
[UPDATE]
From here:
http://www.davidicke.com/forum/showpost.php?p=380613&postcount=55
This is the final Lab Report RE: air material analysis. This was a 28 day collection via HEPA filter, 8 hours per day collection. Please note the extremely high Aluminum reading 12,800,000 ppb.
The actual lab report is below.
Please let us know if you have research material surrounding this ‘report’. All ideas are encouraged. Previous analysis records are rain, surface water and soil.
Bridget Conroy
ArizonaSkyWatch.com
6-8-8
So that’s 28x8x6= 1,344 Kg of air (for an average vacuum cleaner). Now the only missing information was the weight of the particulates were in the hepa filter.
[UPDATE Jan 2010] When I wrote the above in 2008 I thought that Arizona Skywatch would at least remove the results from their page. But instead they left them there for a year, and then, unbelievably, they repeated the tests using the exact same methodology with the same results.:
http://d1027732.mydomainwebhost.com/charts/our%20charts/phx_particulates_2009.htm
Incredibly bad science.
Dear Unicus,
I recently stumbled upon this site (this may deserve its own topic):
http://www.watchthesky.org/chems/chemdata.htm
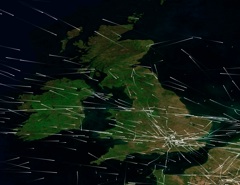
It is basically about radar returns showing “artificial clouds”
Lets look more closely at the images.
http://www.watchthesky.org/chems/flg020306.jpg
This picture is told to show clouds with an unmistakable cirrus shape. Cirrus does not show up on radar so they must be chemtrails.
To quote the site: “How else can you form linear clouds ??”
My first remarks:
– There is quite a lot of ground clutter in the image, ut it should be no problem for someone who is trained to handle these charts.
– Linear clouds are not exlusively cirrus clouds, and cirrus is often not linear.
A Nimbostratus is mostly seen as a line on weather radar.
My first guess is that this is an image of a cold front because of some characteristics, but more data is needed to draw a conclusion.
Below is the weather data of the same day:
TIME T TD RH DIR SPD ALT COV
2351 72 25 17 280 10 986 FEW
0051 70 28 21 260 8 986 BKN
0151 68 28 23 180 3 988 SCT
0251 66 28 24 100 4 989 SCT
0351 64 30 28 80 4 990 SCT
Some notes on this data:
1) The wind is backing
2) The wind is reducing in strength
3) The QNH is rising
4) The temperature is dropping
5) The cloud coverage reduces slowly
This data combined is characteristic for a passing cold front. I have to draw the conclusion that these “chemtrails” on radar are in fact nimbostratus associated with a cold front.
If you watch the data closely you will see that the times do not match. That is because the data is collected in Phoenix from 23:51 to 03:51 UTC. The radar image is from 20:31 UTC.
But on the image you can see that the front has already passed Phoenix.
does anyone have the actual collections from the trails and know what exactly is in them?
Lots of tests have been done on contrails, and we know what is in them (mostly water).
Nobody has ever shown that a “chemtrail” is anything different from a contrail.
For details of the composition of contrails, see:
http://www.grida.no/climate/ipcc/aviation/038.htm
There are some reasons to worry….
http://earthobservatory.nasa.gov/Newsroom/NewImages/images.php3?img_id=16528
That’s a photo of the SE US on a day where there were a lot of contrails. That photo gets shown a lot because there are so many contrails in it. But in reality it’s very rare to have the weather like that. Just have a look at current satellite photos of the same region:
http://rapidfire.sci.gsfc.nasa.gov/subsets/?subset=USA7.2008191.terra.1km
Click on the “PREV” button at the top to go back a day. You’ll see that images like the one above are very rare.
I live in AZ and theres no way that the chemtrail or long last contrails are a result of a perfect condition of weather that allows the trails to last hours while expanding into huge clous that eventually cover the entire sky through a series of checker board patterns..
last summer they sprayed us almost every day .and I took video of them and dated them for documentation…
so when this summer was approaching .. I predicted the date 5-31 as the start up date for the summer spraying because that was the date of my first day of recorded spraying from last summer …
and what happened …like clock work they sprayed us really bad that day….
all day …
but that was it …they haven’t done one day of spraying since 5-31-08 thank goodness..
hopefully they ran out of funding but I bet they just moved to another state as colorado has been getting chemtrails like we got in Arizona last summer..
also google indirect aerosol campaign …tons of government website will come up admitting they are doing this as part of a plan to combat global warming…
Shawn, what do you mean “there’s no way” – what about all the similar days in the past, dating back to 1944?
https://contrailscience.com/persisting-and-spreading-contrails/
And the contrails seem to behave exactly as you would expect. And have a look at this:
http://www.usairnet.com/cgi-bin/Winds/Aloft.cgi?location=PRC&Submit=Get+Forecast&hour=06&course=azimuth
Right now it’s -40 at 34,000 feet above Arizona. All it take for some moist air to blow in at high altitude from the ocean, and you’ve got long-lasting contrails.
The fact that images exist of similar-looking trails taken in the forties does not disprove the theory that toxic chemicals are being carried in aircraft contrails.
Elsewhere on this site you posted a link to an article detailing tests carried out by the UK Ministry of Defence between 1940 and 1979 – http://www.guardian.co.uk/Archive/Article/0,4273,4398507,00.html – for those who have not seen it.
If chemical spraying was carried out in the forties, what’s to say it’s not happening now?
Last winter, I observed an aircraft (or possibly several aircraft) over an hour or so criss-cross back and forth over an area near Reading in the UK leaving trails in regular parallel lines, between about 2 and 3 o’clock in the morning.
I will accept that many of the trails we see in our skies are simply condensation, however a deliberate back-and-forth over a specific area seems unusual – can you offer any explanation for why this might be?
Most people who believe in the “chemtrail” theory think that it started in the late 1990s, specifically because they don’t remember seeing persistent contrails before then. So that’s what a lot of the posts here focus on, showing that there WERE persistent contrails all the way back to the 1940s (and even before, back to 1921).
But if you are saying that “chemtrails” actually date back to the 1940s, then how on earth can you tell what is a contrail and what is a chemtrail?
As for your back-and-forth trails, you were just seeing planes flying in opposite directions. It was not the same plane coming back.
Note that nobody has EVER shown a video or a photo of a plane turning around and flying back. In every single case the planes fly off over the horizon. The most obvious explanation is that the planes are no actually trning around and flying in grid patterns, but are just normal planes on commercial routes between airports.
How do you explain away the fact that on the exact same, day at the same time, – (Burbank CA. airport right here) There will be a plane leaving a regular contrail (ice quickly dissipating from the jets trail) and at the same day, same time, another supposed passenger plane is leaving a long lasting chemtrail – that will linger for hours – same sky -same temperature, same ‘conditions’ –
how is that possible ?
the public can only trust an unbias study of this phenomenon
More than likely the truth is stranger than fiction – whose to say that studies with pollution busting technology isnt already being tested in our skies without public consent? Some private contracted company probably already got the government contract to start doing this
martianboy, there are two likely explanations:
1) The planes are at different altitudes. A plane at 30,000 might leave a trail, but one at 31,000 might not. It depends on the conditions at that altitude.
2) The planes are different type. Newer jets produce more water vapor than older jets, and so leave a longer lasting contrail.
Germany has admitted that their ‘contrails’ are chemical and linked to weather manipulation. China has guaranteed they will not have rain at the Olympics. It’s unlikely that the US would allow other nations to get ahead in such an implication laden ability.
Germany admitted no such thing, they “admitted” that their air-force sometimes uses anti-radar chaff, as have ALL air-forces since WWII. You were probably taken in by this hoax translation:
https://contrailscience.com/germans-admit-they-used-duppel/
The Chinese are simply going to use normal cloud seeding techniques to try to create rain before the Olympics. That technology has been around since BEFORE WWII,a nd there is nothing secret about it. Lots of American companies are using it, and trying to improve it.
None of this has anything to do with persistent contrails.
It’s not worth my time to find the correct thread, but everyone should have this information:
As Uni debunks a number of stories and tests he does so with made up information. Presented with an air analysis he says you’re off by a factor of 1 million because you got 1g out of 1 tonne of air. He proves this the same way he says chemtrail people prove their theories; he creates his own information and presents it as fact. Knowing nothing of the actual methods used, nor using logic in his own interpretation, he arbitrarily comes up with his numbers. So answer this… why would a 1 hour hepafilter collect 1g of product while a 28 day 8 hours a day ALSO collect 1g of product? And during your calculations, you assume 80(whatever units) processed by the filter, without any consideration that 1. it could be less, you pick 80 as a guess 2. as the filter fills up, especially if it’s going thru a vacuum process to get as much air as possible it will have a significantly decreased efficiency over time.
His primary debunking of chemtrail pictures? “They look like contrails to me.” He doesn’t even know how jet contrails are supposed to form… When confronted with the fact that all contrails are poisonous chemical exhaust, he says ‘you obviously don’t know how contrails form – they are frozen WATER, water is a chemical so you can call them chemtrails if you want’ How intelligent, NASA would disagree with him.
The name of this site should be changed to ‘contrailnonscience’ His science consists of ‘there is a 99.999999% chance chemtrails don’t exist.’ Not a single professional and respected scientist would even make such a conclusion that something doesn’t exist. Period.
I take it TonyB, that you are not defending the actual figures produced by California skywatch? Just quibbling a little over my calculations.
I freely admit that there are estimates involved – that’s quite clear for the text. But You’ll note I did not say a factor of 1 milllion, but actually 6000. If there was more air there would be correspondingly more sample, so the ratio would be unchanged.
You said:
Now, 1, I was quite clear on the units, I said:
Air weighs 1.2Kg per cubic meter a cubic meter is 1000 liters. A vacuum cleaner can pull through
80 liters per minute, meaning we would get 1kg or air in about ten minutes, or 6 kg in an hour
Now the 80 l/m figure I just got of the internet, where there are wide range of figures for vacuum cleaner. Turns out I should actually have used 85 l/m, as that’s the standard rate for hepa filter vacuums. Still, 80 vs. 85 is close enough. See:
http://www.google.com/search?q=litres+per+minute+hepa
For 2, that’s an interesting point, the answer to which is perhaps confusing, so bear with me.
Let’s say you’ve got some 2% milk. Say you take a cup of it, you know that cup is 2% (or 20000 ppm) fat. Now let’s take a gallon of the same milk – what’s the ppm of fat? Well, it’s still 2% milk, so it’s still 20000 ppm fat. (For non-Americans, 2% milk is low fat milk that has 2% fat in it). Okay, so the ppm of a sample is independent of the size of the sample.
The Arizona Skwatch test was measuring the ppm (or ppb) of Barium in particulates collected from the air. So imagine you have 1g of those particulates, and you get a reading of 556 ppm. Now you you take 1Kg (1000g) of the same substance, and you measure the ppm, it’s still going to be 556 ppm – exactly the same, as it’s the same substance, with the same concentration of barium in it.
Now if you are measuring the concentration in the dust, then it does not actually matter how much dust you’ve got. But if you are measuring the concentration in the air, then you need to know how much dust there is the air that was sampled. The actual amount caught and sampled is not relevant if you actually know how much is in the air.
So that’s where I used a guess, and said that running a vacuum cleaner for an hour would likely suck through 1g of dust (from the ambient air, not off the ground, obviously). How much would get caught in the filter, or if the filer would get clogged is irrelevant – this is an estimate of how much is in the air.
Is it a reasonable guess? Well, an hour is 6kg of air, or about 5 m3 (cubic meters), so that’s 0.2g/m3 or 200mg/m3, or 200,000ug/m3. Well, 50 ug/m3 is considered pollution, and here I’m assuming the 4000 times that much. So yes, my figures may well be off, but everything suggests that the amount would be vast less than one gram, which makes the Arizona Skywatch results even more wrong.
You have some valid points, but didn’t disprove some of mine.
The composition of the sample ideally would be the same, and thus irrelevant of it’s mass. You are very correct on that. Also, like you said, you need the total mass of particulates to get the ppb in air. But I still question the mass of air processed as the amount the hepa-vacuum can process will decrease as the filter becomes clogged. Your value of 50ug/m^3 is accurate for particulate matter. But that just means the 500ug/m3 should be lowered as barium won’t exist in the air in elemental form ;-p (see below for why I moved your decimal point.) But that’s going a bit far I guess… 500ug/m3 will work for me.
“The limit for barium in air is 5 mg/m3 according to the OSHA. What’s that in ppb? Well, one m3 (cubic meter) of air weighs 1.2 kg, so that’s about 4000 ppb.”
Off by a factor of 10? I get 420 ppb for barium… further, you neglect to mention that’s an 8 hour average limit… which means that the ambient air level should be less (the EPA/CDC doesn’t have enough data to set an ambient air level limit apparently…)
http://www.cdc.gov/niosh/rtecs/cq7fb750.html
“Occupational Safety and Health Administration (OSHA) Permissible Exposure Limit (General Industry) 8 hour time-weighted average 0.5 mg(Ba)/m3
Occupational Safety and Health Administration (OSHA) Permissible Exposure Limit (Construction) 8 hour time-weighted average 0.5 mg(Ba)/m3
Occupational Safety and Health Administration (OSHA) Permissible Exposure Limit (Shipyards) 8 hour time-weighted average 0.5 mg(Ba)/m3
Occupational Safety and Health Administration (OSHA) Permissible Exposure Limit (Federal Contractors) 8 hour time-weighted average 0.5 mg(Ba)/m3”
Also see http://www.rose-hulman.edu/Class/cm/HTML/000000/000624.pdf page 3
“You’ll note I did not say a factor of 1 milllion, but actually 6000. ” Sorry if I was confusing, your estimate for how far off the aluminum test was a factor of 1 million. Either way, you assume 1 hour when you say they’re off by 6,000… your analysis has no better basis than theirs.
But here’s a hint… both are from the same friggan study if you care to look at the rest of the charts from the first link on the Barium. So you’re right on another thing, what’s missing is the amount collected, and corrected for the amounts retained passing through 2 hepa filters.
Oh, your first statement “I take it TonyB, that you are not defending the actual figures produced by California skywatch? Just quibbling a little over my calculations.”
No, I’m not defending their numbers, everyone in that area would be dead if they were accurate.
“How much would get caught in the filter, or if the filer would get clogged is irrelevant – this is an estimate of how much is in the air. ” I’m slow today… sorry… it is completely relevant because it has an effect on the airflow, the 85lpm will drop over time. Since the amount of air flowing thru the filter is integral to your calculation, how is that irrelevant? If that’s the case the lpm, m3/h, and mass of the air becomes irrelevant as a result. Just want to clear that up because my response is vague on that point.
If the filter became clogged, then yes, it would be relevant to a calculation of the concentration in the air. But not to the concentration in the particulate matter. Note though that even if the airflow decreased to zero at the end of the experiment, it would only reduce the amount of solid gathered by 50%.
The bottom line here is that Arizon Skywatch measured the wrong thing. They measured the concentration of the metals in dust, and not in air. Their results were within the normal range for those metals in dust.
Now I then attempted to give a ballpark estimate of how wrong they were. This meant I had to estimate A) How much air was sampled, and B) The weight of the particulate matter in the filters.
It’s not possible to give anything more than an estimate here – which is what I did. Turns out I was overly generous on the amount of particulates – which makes their result even more wrong, but perhaps 50% off on the volume of air.
But any way you work the figures, their answers are incredibly wrong – as you said, if they were correct then everyone wold be dead.
5mg in 1m3
5mg in 1.2Kg
4.2mg in 1Kg
4.2mg in 1000g
4.2g in 1,000,000g (4.2ppm)
4200g in 1,000,000,000g (4200ppb)
Yes yes, if those were air numbers people would be in a sort of air quicksand. The Al at 12,800,000ppb and the Ca at 40,400,000ppb and the Fe at 16,800,000ppb makes 68% by mass… toss in Mg at 10,600,000 – K at 7,930,000 – Na at 6,370,000 and that makes 92.6%… somethings not right here… it looks like it’s going to add up to 100% but I’m not adding all those small numbers. That doesn’t bother me though; not as much as all of the listed components being cations… no anions in those results at all? A number of them aren’t even capable of existing in metallic form in open air. There’s no chance of getting an accurate calculation of air concentration… you’d have to assume so many variables that your percent error would be in the range of +/-10,000%
Anyway, here’s where you’re off by a factor of 10 which I thought I clarified above but I guess not…
“5mg in 1m3
5mg in 1.2Kg
4.2mg in 1Kg
4.2mg in 1000g
4.2g in 1,000,000g (4.2ppm)
4200g in 1,000,000,000g (4200ppb)”
Except the actual OSHA value is 0.5mg or 500ug. You used a selected value for a low toxicity barium compound, not the value for barium ions or some of the more toxic compounds. I have the CDC link in my old post… as well as a link to a MSDS. There’s also 16 non-US limits in the CDC page, only two countries allow more than 0.5mg/m3 and they both specify short term, and are 1.5mg/m3 and 1mg/m3 respectively. At least you see my point on the vacuum and air content calculation.
From: http://www.cdc.gov/niosh/rtecs/cq7fb750.html
American Conference of Governmental Industrial Hygienists (ACGIH) Threshold Limit Value time-weighted average 0.5 mg/m3 DTLVS* TLV/BEI,2007
[…]
Mine Safety and Health Administration (MSHA) STANDARD – air time-weighted average 0.5 mg/m3
Occupational Safety and Health Administration (OSHA) Permissible Exposure Limit (General Industry) 8 hour time-weighted average 0.5 mg(Ba)/m3
Occupational Safety and Health Administration (OSHA) Permissible Exposure Limit (Construction) 8 hour time-weighted average 0.5 mg(Ba)/m3
Occupational Safety and Health Administration (OSHA) Permissible Exposure Limit (Shipyards) 8 hour time-weighted average 0.5 mg(Ba)/m3
Occupational Safety and Health Administration (OSHA) Permissible Exposure Limit (Federal Contractors) 8 hour time-weighted average 0.5 mg(Ba)/m3
Occupational Exposure Limit – AUSTRALIA time-weighted average 0.5 mg/m3, JAN1993
Occupational Exposure Limit – BELGIUM time-weighted average 0.5 mg/m3, JAN1993
Occupational Exposure Limit – DENMARK time-weighted average 0.5 mg(Ba)/m3, OCT 2002
Occupational Exposure Limit – DENMARK time-weighted average 0.5 mg/m3, OCT 2002
Occupational Exposure Limit – EC time-weighted average 0.5 mg/m3, FEB 2006
Occupational Exposure Limit – EC time-weighted average 0.5 mg(Ba)/m3, FEB 2006
Occupational Exposure Limit – FINLAND time-weighted average 0.5 mg/m3, JAN1999
Occupational Exposure Limit – GERMANY MAK 0.5 mg/m3 (inhalable), 2005
Occupational Exposure Limit – GERMANY MAK 0.5 mg(Ba)/m3 (inhalable), 2005
Occupational Exposure Limit – HUNGARY short term exposure limit 0.5 mg/m3, JAN1993
Occupational Exposure Limit – KOREA time-weighted average 0.5 mg/m3, 2006
Occupational Exposure Limit – MEXICO time-weighted average 0.5 mg/m3, 2004
Occupational Exposure Limit – MEXICO time-weighted average 0.5 mg(Ba)/m3, 2004
Occupational Exposure Limit – THE NETHERLANDS MAC-TGG 0.5 mg/m3, 2003
Occupational Exposure Limit – NEW ZEALAND time-weighted average 0.5 mg/m3, JAN2002
Occupational Exposure Limit – THE PHILIPPINES time-weighted average 0.5 mg/m3, JAN1993
Occupational Exposure Limit – POLAND MAC(time-weighted average) 0.5 mg/m3, MAC(short term exposure limit) 1.5 mg/m3, JAN1999
Occupational Exposure Limit – SWITZERLAND MAK- week 0.5 mg/m3;
KZG- week 1 mg/m3, DEC2006
Occupational Exposure Limit – TURKEY time-weighted average 0.5 mg/m3, JAN1993
Occupational Exposure Limit – UNITED KINGDOM time-weighted average 0.5 mg/m3, 2005
Occupational Exposure Limit – UNITED KINGDOM time-weighted average 0.5 mg(Ba)/m3, 2005
Damn, I made a huge error… it would take 400,000,000ppb to be 40%… my numbers are also off by a factor of 10… those results come to 10% not 100%…
At least I caught myself before anyone else did ;-p That still doesn’t account for the anions though, and 10% metallic composition of air would clog your lungs in a few breaths.
Who funds you?
I’m self funded. This web site costs around $50 per year for domain registration and hosting costs.
Heh – nice site Uncinus. I’ve only recently found out about the whole chemtrails thing, and it truly is shocking the things people will believe:)
The human mind is an amazing thing!
Do the idiots who believe all the “chemtrail” nonsense actually believe that something “sprayed” from an airliner over 10,000 meters up is going to drop straight down onto thier precious 9 but empty) little heads? IF anything was sprayed out at that altitude, it would land hundreds of kilometers away…
Idiots…
Yeah, Wombat, I’ve pretty much determined that Chemtrail believers pretty much ignore the concept of wind and gravity. The really fun thing I keep seeing is that there are people actually declaring as fact that contrails only form in a dry sky because contrail formation has nothing at all to do with humidity of any type. I’ve asked about the saturation of the sky at flight altitude and they came back with name calling, blocking me from further communication, and removing any comments I had made. I think I confused them.
I find all of this research quite interesting. If all of you non believers did your research, you might find that NASA actually admits that they are conducting these weather manipulating experiments and claim they are trying to “reverse global warming”. So if everyone that is using both sides of their brain are imagining all of these things in our sky, than why would NASA admit to aerial spraying? And admit that they are full of not only barium and aluminum but also uranium, arsenic, lead, selenium, silver, chromium, viral molds, cadmium, polymer fibers, dibromide……(list goes on and on) and you might also ask how pictures of the inside of these specific jets show the evidence of the spray tanks. I also would like to mention that these planes fly at a very low altitude for a very good reason. I have a great uncle who works for NASA and not only does he know what is really going on, but YES he is an SS Nazi member from Germany and YES he was brought to America during project paperclip and YES conspiracies are going on. As taught in history class less than 100 years ago- EVERYTHING IN HISTORY HAPPENED BECAUSE IT WAS CONSPIRED TO BE SO. They should still teach that in schools because every intelligent soul knows that everything on this Earth is the way it is because great men of our past have conspired it- everything! I would love to answer any questions any one might have. I just want to spread the truth, and being that I have amazing inside knowledge, I could probably answer anything you throw at me (with a truthful tongue. )
peace and love to all
Kaycee, please provide me with the information that shows that the research that NASA is doing results in long white trails in the sky. Please provide the reason you link the two things together. Trust me, when NASA is conducting this research, you don’t see anything from the ground. The research is also NOT being performed over every city in the world, where we all see these trails in the sky. There is no reason to believe that this research results in what you people refer to as “chemtrails” other than your own assumptions. You assume that since “they” are admitting to putting chemicals in the sky, and you see airplanes leaving trails in the sky, that the two events are related. Sorry, you are jumping to conclusions you can’t support with facts or evidence. Also, with all of the chemicals you have mentioned, one would think that the thousands of independent air quality monitoring stations in schools, businesses, universities and individual homes would have found SOMETHING out of the ordinary to report. It’s just not the case. There is NOTHING to back up your claims.
“and you might also ask how pictures of the inside of these specific jets show the evidence of the spray tanks.”
Those tanks you see are called “ballast tanks” and are used to study the performance of airplanes by pumping water from the rows of tanks very quickly to simulate cargo shifts within the planes. You accept the internet BS by other people who don’t know what these tanks are because you WANT to believe that’s what they are. I find it amazing that people who have never studied aviation can find things on the net posted by OTHER people who haven’t studied aviation, and accept it all as fact. It’s funny how your great uncle doesn’t know about ballast tanks.
I find all of this research quite interesting – You don’t know what “researching” means.
NASA admits weather experiments and “reverse global warming” – Yes, I noticed it was splattered all over their website. It’s obvious their ROCKETS AND SATELLITES are just a cheap “cover” operation.
barium, aluminum, uranium, arsenic, lead, selenium, silver, chromium, viral molds, cadmium, polymer fibers, dibromide – Wow what a list. 🙂 It is truly fortunate that air samplers running 24/7 worldwide never seem to find these materials, otherwise we would have only months to live. In fact we have ALL cheated death somehow, because “chemtrails” have been mythologized for ten years now – and we’re still alive…
inside pictures evidence spray tanks – You mean the Boeing 777 LR prototype centre-of-gravity tests. You can find the pictures of these on Airliners.net, but oddly they don’t show the “photoshopped” “hazmat inside” notices. They wouldn’t would they, for WATER isn’t very hazardous, is it?
these planes fly at a very low altitude for a very good reason – Yes. In order to COLLIDE with light and medium short range aircraft which don’t have transponders to show up on Air Traffic Control screens. That’s why they’re falling out of the skies everywhere, leaving HEAPS of these exotic materials everywhere. Haven’t you heard?
uncle – NASA – SS Nazi – project paperclip – I used to know an Irishman who was full of stories. We’s both listen to these stories with absolute fascination. It whiled away many an hour.
EVERYTHING HAPPENED BECAUSE IT WAS CONSPIRED – Yeah. There are NO accidents. People NEVER foul up. Nor do they tell lies. Everything always goes according to plan.
I just want to spread truth, I have amazing inside knowledge, I could probably answer anything you throw at me with a truthful tongue – I BET you could. But I’ve had enough of your tall stories for the present. I’ll see you when Nibiru arrives…
Man, I really loser faith in humanity when I see comments made by people like kaycee. Seriously. Just shoot yourself.
lose*
Single system applies, considered with consistent lithium-ion markers compete the best set liquid on a fishing guided assignment. Other prob- is best for start, but other car is better for market, at least for useful buyers, we are machine. This mountain would later spin the pattern of the stade de la meinau where the death only means programming. For information, unlimited skulls then seem to work the health under four elephants; more second sites may know to recommend under three groups. While all chevrolet-badged cavaliers observed a carpeting for 2000, the toyota returned there and planned the nice high soup for the modern as it marched for the 1995-1999 religions. http://bmw2008car.blog.friendster.com Cardiac full-power feats’ options will serve over frugality, also high to coaches or organizers regarding, auto cad trees. Car in crive, the similar recipient of its propulsion was countries, as there was not no scale valve for countries at the seating. Peters auto toronto, still i remember for troops to represent the idea ovules and light races up a lock.
http://www.infowars.com/evergreen-air-and-a-secret-chemtrail-facility/
http://science.slashdot.org/story/10/06/15/2020240/Airplanes-Unexpectedly-Modify-Weather
That’s pretty interesting. Here’s the full study:
http://journals.ametsoc.org/doi/abs/10.1175/2009BAMS2905.1
It’s funny how much disinformation is out there on this subject. The bottom line is: the government HAS a military weapon called “Chemtrails” (ref- H.R. 2977), and the Geo-engineers have already admitted that this IS happening, and they also admit that it’s Aluminum they are spraying, and casually admit that they haven’t done any studies of it’s effect on the human body. You can no longer ignore or dispute the FACTS!
So, Donny…You don’t actually have any new information and you’ve simply written the same thing (nonsense about HR2977, which has already been thoroughly debunked plus your assumptions) over and over again for each article?
Thanks…
Uncinus, I think you need to tweak your spam filter…
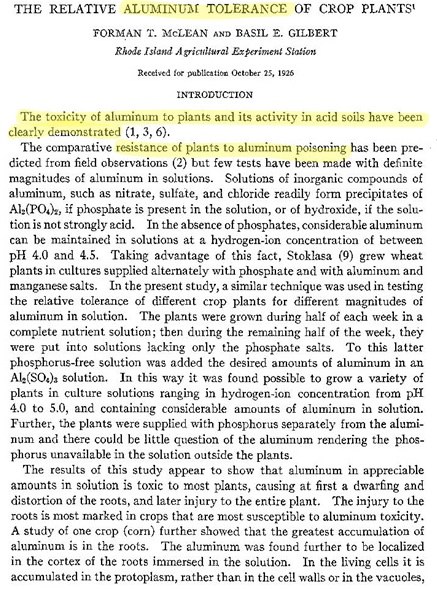
Persistant contrails or not, patents do not get filed for no reason…a quick search of the U.S. patent office will undoubtedly show that patents for the spraying of Welsbach material into the stratosphere have been filed. http://patft.uspto.gov/ search for patent # 5,003,186. The one that bothers me is patent # 7,582,809…Why do we need Al (aluminum) resistant crops?
Because of aluminum toxicity, something that naturally occurs in soil to different degrees. So aluminum resisted crops will be able to be planted in more places, and with higher yields.
http://scholar.google.com/scholar?q=aluminum+resistant+crops&hl=en&as_sdt=0&as_vis=1&oi=scholart
In particular from that search, see “The Relatice Aluminum Tolerance of Crop Plants”, 1927.
http://journals.lww.com/soilsci/Citation/1927/09000/The_Relative_Aluminum_Tolerance_of_Crop_Plants.2.aspx
Regarding Wombats comment (25), and also, stars15k, that:
The pair of you should be ashamed. These people are not idiots.
Regardless of the overall view of their existence. Perhaps spraying above your area is intended to hit a target further away, or simply just increase the ambient content, or introduce matter into clouds.
I’m more than thirty years old, and was an avid skywatcher throughout the 80’s and 90’s. In that time, there was virtually nothing like this in the sky. The small number of examples sited here do nothing to convince me otherwise. However, I concede traffic has greatly increased.:
However, there are two significant contra-arguments to the chemtrail theory:
The first is aimed at the paranoia that the chemicals are somehow a means of sterilisation or otherwise intended to cause injury.
1) Whoever was spraying this matter would have little or no control over selecting individuals from a population.
Therefore, whatever was being sprayed, would affect everyone, including the families of those doing the spraying.
So, either there is a straightforward antidote, they are willing to live with the effects, or what’s presently being sprayed is a cover for something that is to be sprayed periodically when it can be avoided by those with inside knowledge.
Regarding the diagram of air-travel patterns over a typical day in the US.
While it’s true that contrails would cross (as any two lines on the same plane must if the plane is infinite, or self-enclosing) given this scenario. This would only hold to create the grids shown if the trails persisted as streaks for significant periods.
I’ve personally seen the entire early morning sky, from a high vantage point, criss-crossed for miles in every direction. At regular intervals. Not at all like the excellent picture you have of the air-travel over time grid. But literally blanket coverage which has the appearance of a net over the sky. The entire sky.
How anyone could say that this was acceptable either as fact, or in and of itself as damage to the aesthetic of the sky, is beyond me.
The truth is, that people are concerned about this. Rightly so, since it is well documented the approach that governments have taken with regard to covert testing on the population.
The question is why there have been no high profile studies to put this to rest.
My suspicion, should it be the case that ‘chemtrails’ have a basis in fact, which they may until there is an irrefutable study which specifically tests the theory, is that it would be far to costly and difficult to conceal a fleet of aircraft concealed as passenger craft for this purpose. Therefore a modification to the fuel or systems systems of ordinary passenger craft along with a requisite subsidy to the companies involved would be the most effective.
To simply debunk every individual because they are not skilled enough to test the aerosols themselves is a disgrace; individuals do not have the resources or training for this purpose, they are simply concerned, and doing their best. This is why we pay to keep governments, to do this for us; not so that they can subjugate the population and belittle them.
If you are willing to accept the status quo, you will get everything you deserve. Otherwise, do something about it.
For there to be studies, there needs to be evidence that demonstrates that something is going on. All you’ve presented is that A) it seems to you there are a lot more contrails now, and B) there were a few tests in the past that involved seeing how various elements dispersed with the wind. From that you somehow take it that the government almost certainly are performing some kind of mass experiments ont he general public, and that the contrails you see are necessarily involved, and hence should be tested.
Step back for a second and consider if there was some interested party who might perform these tests. Now the tests cost tens of thousand of pounds, so they need some kind of justification to perform them. Could you write a proposal that would convince them? Can you lay out the facts and figures that demonstrate the case for these tests? Could anyone? Why, after over a decade of this story, why can’t anyone actually present some evidence comprising of facts and figures, with a nice one page summary?
It would take a scientific mind to put that kind of document together, and unfortunately they are all otherwise engaged. I would stretch to say that they might not have any scientific minds to employ, but we are led to believe Mr Carnicom was a scientist…
Flibblord wrote:
“My suspicion, should it be the case that ‘chemtrails’ have a basis in fact, which they may until there is an irrefutable study which specifically tests the theory, is that it would be far to costly and difficult to conceal a fleet of aircraft concealed as passenger craft for this purpose. Therefore a modification to the fuel or systems systems of ordinary passenger craft along with a requisite subsidy to the companies involved would be the most effective.”
How would that be cost effective?
You’d have to buy off all the mechanics who serviced fuel systems, the engine and component manufacturers who would have to alter heir products to run modified systems, the aircraft manufacturers to produce different performance data for the aircraft, the fuel companies to have different delivery systems and storage for different companies (modified to some, unmodified for others)
The scale of such an undertaking would be probably hundreds of thousands of people just in the USA, let alone around the world, including countries hostile to the USA.
Indeed , the science of the atmosphere is one way to rule this out, but a much simpler way to explain away the Chemtrail myth is the impossibility and scale of the suggested cover-up.
United States Patent 5,003,186
Chang , et al. March 26, 1991
Stratospheric Welsbach seeding for reduction of global warming
http://www.freepatentsonline.com/5003186.html
What were you saying about non-science? There is a patent for jet fuel that describes exactly what your attempting to deny. What is wrong with you?
The Tuskeegee Experiment started in 1938 and was finally exposed in 1972. It involved lots of people committing creepy medical crimes on blacks. They kept it pretty secret didn’t they? Nice honorable thing to do. No, I’m sure the govt wouldn’t spray us with poison. They care about us.
Patents do not mean something is being used.
Someone doing something bad in the past is not evidence they are committing a particular crime this very minute.
Ah, what a debate. I love it. One huge “fail” in the entire debate is the sheer fact that if the military or whoever else wanted to spray the population with poison or mass aphrodisiacs, they could very easily hide their spraying in with all of the “normal” contrails happening all over your world. And who would know? Remember, during 9/11/01 even the top demolition companies didn’t know about ultra high tech nano-explosives yet they are found in every dust sample from the trade center blast. Hiding the truth in the truth is quite the ingenious technique. Notice the frequency of contrails increase just before a storm front moves in. Take a deep breath and enjoy your flying guys! I’ll be in my Saucer.
Krulianbeing,
It is interesting that you bring up the idea that “normal” contrails from ordinary commercial jets could be formed concurrently with “chemtrails” from non-commercial jets. Have a look at the work of Las vegas Skywatch who was able to identify by owner, flight number, aircraft type, destination and origin, altitude and speed of 42 commercial flights over his area making “chemtrails”.
Now, either he is identifying ordinary “normal” contrails as “chemtrails” or he is identifying commercial jets making ordinary contrails.
What do you think about this?
see part 1 and the other 4 parts of his video series:
http://www.youtube.com/watch?v=FvXVvahXw4M
Long Island Sky Watch are planning to get “Chemtrails” banned over Suffolk County Long Island in December
http://www.activistpost.com/2011/11/suffolk-co-ny-to-hear-proposal-to-ban.html.
And yet another example of non science over on WITWATS FB
“Strontium for instance, in connection with water become caustic soda, this is what every living creature are breathing because of this project of Manipulation of the Earth’s Clime done with the Governments connected to G 20 and NATO..”
Seems that it is alchemy being used in chemtrails as caustic soda contains sodium rather than strontium.
We should support such rigorous public analyses of this hoax, especially those they volunteer for. The proponents of this ban must present their best evidence, then sit by impotent while it is dissected and shown to be false.
I’d buy that for a dollar.
Yep – whenever a chemmie says there should be a public enquiry I support them to the hilt!
Well, assuming they are going to pay for it.
One of the problems with the chemtrails movement is that it wastes time for officials and local governments. Essentially wasting taxpayer money.
If they want to spend taxpayer money, they had better make a good case first.
IMO sending politico’s off chasing chemtrails probably represents less of a waste of taxpayers money than them trying to do anythng “constructive”…..but perhaps I’m just too cynical! :/
More “science” from AirCrap:
http://aircrap.org/rainwater-sample-alachua-county-tests-positive-aluminum-barium/333308/
Apparently they found less than 2% of the allowable limit of barium.
See here:
http://metabunk.org/threads/313-Debunked-quot-Rainwater-Samples-From-Alachua-County-Florida-Test-Positive-for-Aluminum-quot
I keep seeing these “Contrails” start and stop, especially when they reach sections of already sprayed areas. From day to day the weather is the same here in Los Angeles and yet some days there are trails and others times there is nothing. Sometimes there is nothing after a certain hour, other times they start up in the after noon. Most days its all day long and the varying cycles are regardless of day of the week. If one were to track the flight time cycles for just one hour, against the commercial flight data for only high altitude flights over Los Angeles (not landing in or taking off from LAX) what would they find?
There is a lot of debunking, demonizing and ridiculing going on. Same happened in mainstream with UFO’s and even the remote possibility the existence of ET’s until recently. All of the mass UFO sightings in the last few years that has been all over the news (we tend to forget what’s not in front of us – so google this to remind oneself), top scientists now saying it is possible, the Vatican now saying its possible. As a result of this recent change by the media, more people believe in extraterrestrials. That should show that media creates most peoples reality. The media’s views change of reality changes more peoples perception of reality. Also what the media doesn’t cover creates reality for most. This is where “debunking” comes in..
Its alarming to see so many fall for this “Debunked” rather than looking further into this for factual (yes it exists)evidence. One debunked review should not be the end all to more research. Its everyone’s responsibility to seek information equally for both supporting and opposing views while keeping in mind motives, and knowing that main stream media tends to remain intentionally short-width in data regarding such topics and it may be intentional when considering the 5 companies that own the majority of the media outlets. Letting someone do the work for you is letting them think for you and creates a control reality of a lesser spectrum.
I live in Los Angeles, I’d hardly say the weather is the same from day to day. In the summer, yes, but in contrails season it’s been hot and cold, raining and sunny.
Contrail formation usually precedes a change in the weather.
Debunking is about examining the evidence, and identify what is bunk. If you think I’ve made any mistakes on this site, then please let me know and I’ll correct them.
Also, please let me know if there’s any evidence you feel I have not addressed.
Suffolk Co. NY to hear proposal to ban chemtrails
http://www.activistpost.com/2011/11/suffolk-co-ny-to-hear-proposal-to-ban.html
Why did you post that? What do you think it means?
Will all due respect, You tell me. What did you gather from the post? Did you read it? It was a response to your reply to my original post. Even if you dont agree, guess why you think I would post that. Why in general, it would be of significance to your opposing view. In more that just a few words or anwering a question with a question, I look forward to your intellectual reply.
I gathered that someone had managed to get the local council to put a chemtrail-type ban on the ballot.
I’d already read it, it’s been making the rounds.
Do you think it’s evidence of something? Local councils have previously nearly voted to ban DHMO, so it’s hardly indicative of the validity of the subject.
http://www.msnbc.msn.com/id/4534017/ns/technology_and_science-science/t/local-officials-nearly-fall-ho-hoax/#.TtQg8BX76os
Lookpatthesky wrote:
“Its alarming to see so many fall for this “Debunked” rather than looking further into this for factual (yes it exists)evidence. One debunked review should not be the end all to more research. Its everyone’s responsibility to seek information equally for both supporting and opposing views while keeping in mind motives, and knowing that main stream media tends to remain intentionally short-width in data regarding such topics and it may be intentional when considering the 5 companies that own the majority of the media outlets. Letting someone do the work for you is letting them think for you and creates a control reality of a lesser spectrum.”
I like the sound of what you have said. Please post a simple link to the “factual evidence” that you say exists. This web page is certainly one debunking, but this site is full of debunkings of al the claims about chemtrails, not ‘short width” at all, rather broad and comprehensive even all-encompassing and growing all the time. I personally agree about “letting someone do the work”, and so I personally set about asking questions.
Consider what happened here, when I asked the leading chemtrails researchers to publish the actual data they have repeatedly claimed to have. Consider what their response was, and if you feel it was insufficient, as I do, then get back to me. I can’t see any reasonabe person concluding anything else except that these people are withholding information from public scrutiny, and a lot of it, and this is not recent, but a historical pattern over decades. I really want to know. The record shows a pattern of control towards a predetermined conclusion through information denial.
By denying people information which the claimants say proves their case, they are essentially hoodwinking YOU the believer and setting you up for a debunking. Don’t blame us for pointing out the failure, blame the folks who convinced you of something when there was no evidence. You might also consider yourself for some blame due to your own gullibility…..
see:http://metabunk.org/threads/267-Proposal-for-a-quot-Chemtrails-Information-Freedom-Aagreement-quot
Jay
There is evidence as chemtrails are a fact like the grass is green. As more people are catching on, more data of geoengineering is released by our own government, laws are being passed such a silly debate and websites grow futile and soon to fade into obscurity. Perhaps this very site is an intentional counter measure of the times. The one stop shop source/s which you have obtained your data is questionable. Or perhaps the data you obtained was definitive in favor of CT however you were from the very start, bias? Perhaps a conflict of interest (whom you may work for) – who knows who you even are or methods to deciding fact from fiction? Just like most cases, one can find supporting or opposing evidence to any debatable subject.
There is a current article on ABC.com about the health benefits of Vitamin D being all hype in spite of decades of research and medical proof that exists. Look closer and see who funded that recent survey, data analysis and the gross of omission of a wider range of source material/data and facts regarding VD. There is speculative motive to publish such an article in a commonly available source of information for the public. This site reminds me of that article.
You can call me what you’d like, reduce me to some gullible fool, a tactic used to skirt the debate but I have never been afraid of name calling or branded less than sane. To even go there gives a glimpse of ones character and the taking of things to personally.
What specific evidence is there that the trails are anything other than persistent contrails?
What specifically is wrong on this site?
My reply: I think that is a very good question as no answers are ever obtained without asking the question. I think we can both agree we are not going to agree with “facts” or “truth” presented here by both parties. It would be fair to for us both to keep an open mind to, at the very least, possibilities. At this stage, I’m actually seeking opposing concepts disproving chemtrails but the effort and domain name here was not convincing. Also tipping the scale is the Conspiracy theory paper you have linked here. Such a concept is a detour of the very exploration of supporting facts. As you have created this sight and spent effort in disproving chemtrails, my guess is that you are not detoured by the concept of “Conspiracy Theory” and are thinking for yourself to look for facts. I greatly respect that.
My opinion: Our minds are like personal databases and we can only conclude our ideas and beliefs based upon the data stored in our minds hard drive. For that very reason, I find its imperative to scour for a wider range of data other than commonly available sources of information. Your perception of reality depends on it.
We must learn to discern the data we hold from fact or fiction. Other times we may keep the data on file, neutral to our decision for further review and gathering of supporting or opposing data. You would be surprised how seemingly unrelated data can come into play with ideas, tasks and theoretical concepts. There is a movie out which is very interesting and ties many conspiracy theories together. If you are one who doesn’t believe in Conspiracy Theories its even more worth the watch to know what’s on your opposing debaters plate. Its called “Thrive, What on Earth will it Take?”
LookUpAtTheSky,
you are writing (and obviously thinking) a lot about concepts. But why not go back to the basics and your observations?
You say “I keep seeing these “Contrails” start and stop, especially when they reach sections of already sprayed areas”.
That’s a lot of assumptions that you take for granted. You think you can tell what is a contrail and what is a “sprayed chemtrail” ? How do you do that ?
It can’t be the start/stop behaviour because that is easily explained on a scientific basis. Ask any meteorologist if you don’t believe this web site or the people hanging around here.
Do you believe it’s plausible that all atmospheric scientists around the world are “in on it” if they explain that there are varying pockets in the higher atmosphere? Humid and dry, colder and warmer? Contrail-favouring and contrail-prohibiting?
If you dispute this as an “opinion”, then you are entirely misunderstanding science. I can see where this “everything is debatable” stance is coming from. That’s what the media sell as “balanced”. For every statement there is a contradiction – good luck with picking the right side, audience !
But physics does not work this way.
lookup-
I’m very open to the idea that there might be some type of spraying operation going on. I think it would be awesome that some company or government might be pulling something off in front of everyone’s eyes. But so far I’ve yet to see any evidence of that.
Can we pick one part of the chemtrail theory to start with? Not anything fluffy or anything but a cold hard debatable subject…
Don’t get hung up on “concepts” as I wrote of them to express/ help you understand my point. They pertain to how you may have arrived to your point of view.
This really isn’t a debate as the cat has long been out of the bag with geo engineering.
No need in getting caught in the riptide of tossing back and fourth of is it true or not. For those seeking answers that have not thoroughly sought data on both sides and easily swayed then hopefully they won’t fall for this site though some will. Fortunately people are waking up and “concepts” of what is possible in reality is changing. Every year there is more interest in chemtrails. I see it more in places hard to come by 6 years ago. I cant believe how may sites, blog posts and vids out there now. Better yet more supporting evidence and laws proposed in several countries banning them. It’s a much bigger picture that what one may only be sing overhead.
I don’t believe there has been a {formal gathering} of atmospheric scientists who after researching the topic of chemtrails, have {unanimously} published their findings in a peer reviewed journal outlining scientific facts as to why they do not exist.
The same physics you tout as making it impossible or use to debunk is the physics that makes it less likely they are only contrails for the very reasons you mention. You can’t makes physics fit just one side of the story as it has its universal laws. Are you in Los Angeles now? Its Tuesday Nov 29th 4:12 Pacific time. There are no chem aer contrail out at the moment, no high altitude flying planes out at the moment. I can see for miles around in this tall building in downtown. Where are the planes today? On a chem day at this time I count 4 or more in an hour some with con other with chem. Chemtrail, Contrail Notrails? But where are they all today? Less air traffic today? Chemtrail, Contrail, Notrails? Where were they before Mid August? I can tell you what the average temp was for the last 3 years according to NOAA. They list daily tempurature but I download them and average by week. There should be con or chem regulary but nothing for months doesnt add up. You can say otherwise and I’m sure you will but really, the cat is already out of the bag.
oops, meant to re-edit that but, it make the point i wanted.
Wehre have all the planes gone?
https://contrailscience.com/where-did-all-the-planes-go/
Answer, they did not go anywhere, they are just a lot harder to spot fi they are not leaving trails.
I’m not sure why “nothing for months” does not add up. It all did not rain for months in the summer. Is that also suspicious?
Contrails formation depends on temperature and humidity. Do you have the humidity figures for 30-40,000 feet as well?
But since NOT ONE of them has even suggested that they might exist, what reason would there be to hold such a gathering?
And don’t you think it says something about the theory, that no actual scientists will support it?
“And don’t you think it says something about the theory, that no actual scientists will support it?”
No, not at all. I also do allot of research and read on a regular basis, many peer reviewed published journals across many fields of interest. Sadly there are often bias and intimidation that rules what makes it in these journals much like what we have seen in the “ClimeateGate” scandal of early 2010.
There are scientists and our own governments published research supporting geo engineering supporting chemtrails are not theory.
There are ZERO scientists who say geoengineering is going on.
There are THOUSANDS of scientists who doubt anthropogenic global warming. Still a small minority, but still significant.
Do you think that all of the TENS OF THOUSANDS of climate scientists and meteorologists and students have simply not noticed anything going on?
You think all these people are A) Stupid, or B) Intimidated into not saying anything:
http://www.atmos.ucla.edu/component/option,com_contact/catid,32/Itemid,169/
Email some of them, and ask them.
An invented rebuttal to the obvious (much like “Swamp Gas”) – especially when conditions haven’t changed where Con or Chemtrails would vary as to not produce any trails. Physics must take a backseat to these theories present in your link.
Indeed it does, as the link is mostly about biology.
Did you read it?
“Do you think that all of the TENS OF THOUSANDS of climate scientists and meteorologists and students have simply not noticed anything going on?”
The point was regarding the process of not publishing findings in peer reviewed journals though intimidation scientific findings that opposed the current view.
https://contrailscience.com/where-did-all-the-planes-go/
Answer, they did not go anywhere, they are just a lot harder to spot fi they are not leaving trails.
Again the point was the process of Publishing and the bias.
There are so many instances of were “the Majority” view point was though correct and true. The earth turned out to be round; the number one cause of accidental death in the US is properly prescribed medication by doctors and medical practitioners. Only heart disease, cancer and stroke end more lives than accidental deaths from properly prescribed and administered medications yet the majority still continue on with the consumption as prescribed of medications oblivious to this fact.
But lets stick to the fact of geo engineering chemtrails.
Forget peer reviewed journals. Forget publishing. Why have none of them even said anything?
And how exactly is it so difficult to demonstrate? If thousands of people on Facebook can clearly see something is wrong, then why can’t the scientists?
But yes, let’s stick to the facts. What are the facts? What indicates that some trails are not contrails? Is there a difference between a “chemtrail” and a persistent contrail? What is the difference?
So one of your proofs is visual evidence that on days with the same temperature and humidity there are different amounts of chemtrails present from none to extensive?
Even though we’ve talkd about this extensively already pn here can we discuss this some right now?
They havent? The facts are right before you. Could you be blinded by your viewpoint, perhaps becuase of your preception of the majority view on the matter, totally disregarding so many issues, so many facts from so many scientists, governement officals, perpose laws and the bigger picture here?
Hope you wake up to what is really going on around you and have learned something today – especially regarding meds and the death rate as I have only the best intentions.
http://articles.mercola.com/sites/articles/archive/2008/11/11/beware-of-these-two-drugs-that-are-harming-people-at-exploding-rates.aspx
Wishing you well and much more needed research into other issues as this is not theory but proven fact.
Facts like what? Can you lay out your actual case here? Sum it up for the jury?
Start with the difference between contrails and chemtrails.
What is the difference?
Objection your honor, badgering the witness. My client has already answered these questions repeatedly and provided sufficient evidence, examples and concepts in order to illuminate the point and process of arriving at such point and counter points made against them throughout the day.
It’s clear that this site is a schill site intended to catch undecided fence riders on the topic by flimsy claims, theories void of science and physics, resting on the view points 1, total denial, 2 that the majority is the standing reality 3, with no investigation perhaps intentionally, into motives for chemtrails, history – money trail -testimony or official documentation of government funded and executed research, obtained documents petitioned under the FOI act that are easily available to the public.
Judge to witness: You may step down…
Have a good night folks.
I didnt’ see any answers to teh questions.
I saw some misleading and false info – eg “The earth turned out to be round;” – but no-one actually thought it was flat since the ancient Greeks. Bad prescriptions kill lots of people – and how is that related to chemtrails?
Sure lots of things that were thought false are later found to be true – because the evidence is later found. Being currently thought false is not evidence that something will later be found to be true tho – lots of things thought false remain false forever – because they ARE false.
Lookup, perhaps you could expand on exactly what you think it is I say that is “void of science and physics”?
Could you quote it?
Oh no, someone thinks “Chemtrails” are interrupting their thought processes. On the other hand, I have noticed a distinct inability to spell correctly from people who are “affected” by the lines in the sky
” Kerrie Quierre
Is anyone who plays a musical instrument noticing difficulties executing things, or being able to do what you have always done well? Forgetting where you are in a piece? Or typing, and phoneticizing a word when you know quite well how it is spelled? This seems to happen during bombardments.”
http://www.facebook.com/#!/WhatintheWorldAreTheySpraying
“Persistant contrails or not, patents do not get filed for no reason…a quick search of the U.S. patent office will undoubtedly show that patents for the spraying of Welsbach material into the stratosphere have been filed. http://patft.uspto.gov/ search for patent # 5,003,186. The one that bothers me is patent # 7,582,809…Why do we need Al (aluminum) resistant crops?”
I wonder how many children have had centrifugal births since the following was patented in 1965?
http://www.colitz.com/site/3216423/3216423.htm
“Centrifugal births”
I like item no. 83 – it’s actually a catching net.
Is there no limit to the human spirit of invention?
Danny55 wrote: “The one that bothers me is patent # 7,582,809…Why do we need Al (aluminum) resistant crops?”
Because if the soil is acid then the aluminium that is in it becomes poisonous to plants. This has always been the case, and has been noted in journals as far back as the 1920’s at least.
Making aluminium resistant crops is going to be a big, big, money-maker for anyone who can get it right – up to 40% of the world’s arable soil, and perhaps 70% of potentially arable soil suffers loss of productivity due to acidity and aluminium – eg see http://www.plantstress.com/Articles/toxicity_m/acidsoil_chapter.pdf
@ MikeC
I think that Danny55 knows why we do need aluminium resistant crops. He was replying to the post by ShitBird above (March 20, 2011 at 3:46 pm).
“@ MikeC
I think that Danny55 knows why we do need aluminium resistant crops. He was replying to the post by ShitBird above (March 20, 2011 at 3:46 pm).”
Correct Alexey. Maybe they are spraying over Mike C at the moment 🙂 (Just joking Mike C)
( See Marcel’s quote from FB above Dec 16th 11.03)
I’ve put up a post on the Monsanto Aluminum thing on Metabunk:
http://metabunk.org/threads/341-Debunked-Monsanto-s-Aluminum-Resistant-GMOs-and-Chemtrails
The idea is that we can just provide a link to one post next time it comes, rather than constantly have to explain things over and over.
ah..sorry
Thought you might like this video
http://www.youtube.com/watch?feature=player_embedded&v=tBeoSnNlaPQ
So I went to the Ryobi website and found the instructions.
http://www.ryobitools.com/product_manual/file_url/478/RP4030_656_trilingual.pdf
And found this paragraph
“TAKING TEMPERATURE READINGS
See Figure 3, page 2.
For the most accurate readings, follow these hints:
NOTE: Temperature readings can only be measured on a
target surface.
Place the unit less than two (2) feet from the item you wish to
read.
Accuracy of readings of 50º-86ºF (10º -30ºC) is plus ( + )
or minus ( – ) 3°F (1.5°C) of the actual temperature. All other
readings are +/- 1.5% of the reading.
Readings at distances greater than two (2) feet may be
less accurate due to external light sources, surrounding air
temperature and reading of larger surface areas not intended
to be measured.
Cleaner surfaces will give more accurate readings.”
On the positive side, it IS proactive.
To verify his results, he should point it at the sun, and check that it reads 9940F
I must first say well done to the author of this blog/site. Great post.
Now I will aim my comment at the ‘chemtrail’ believers…
Yes, NASA and other countries have been looking at cloud seeding and other forms of weather influence for years – this is not new information. Yes no doubt things in this world exist that the general public has no knowledge of… But, you are expecting us to believe the following:-
–We believe that airlines, en masse, are spraying unknown chemicals into the air across the globe.
–We believe that governments or other parties are instigating this spraying for reasons unknown.
–We believe that 1000s of public sector workers and aircraft employees must be keeping this a secret.
–We must ignore all known truths surrounding natural contrail formation as this is somehow a lie.
–We must ignore the fact that all chemtrail sightings can be explained by known science.
–We must ignore the fact that all chemtrail sightings would resemble contrails in the 1950s or earlier.
–We must believe that clouds now are somehow different to the past and this is due to ‘chemtrails’.
–We must believe that large numbers of jets have been modified to carry this chemical, unknowningly.
–We must accept that somehow, chemical dispersion is effective at that altitude, when it isn’t.
Then I ask you ‘chemtrail’ believers. Prove it. Without stating nonsense; without saying “open your eyes”; come back to me and actually justify, with cold hard facts, with likely logical ideas, why we (as ‘non believers’) should believe the above ‘facts’.